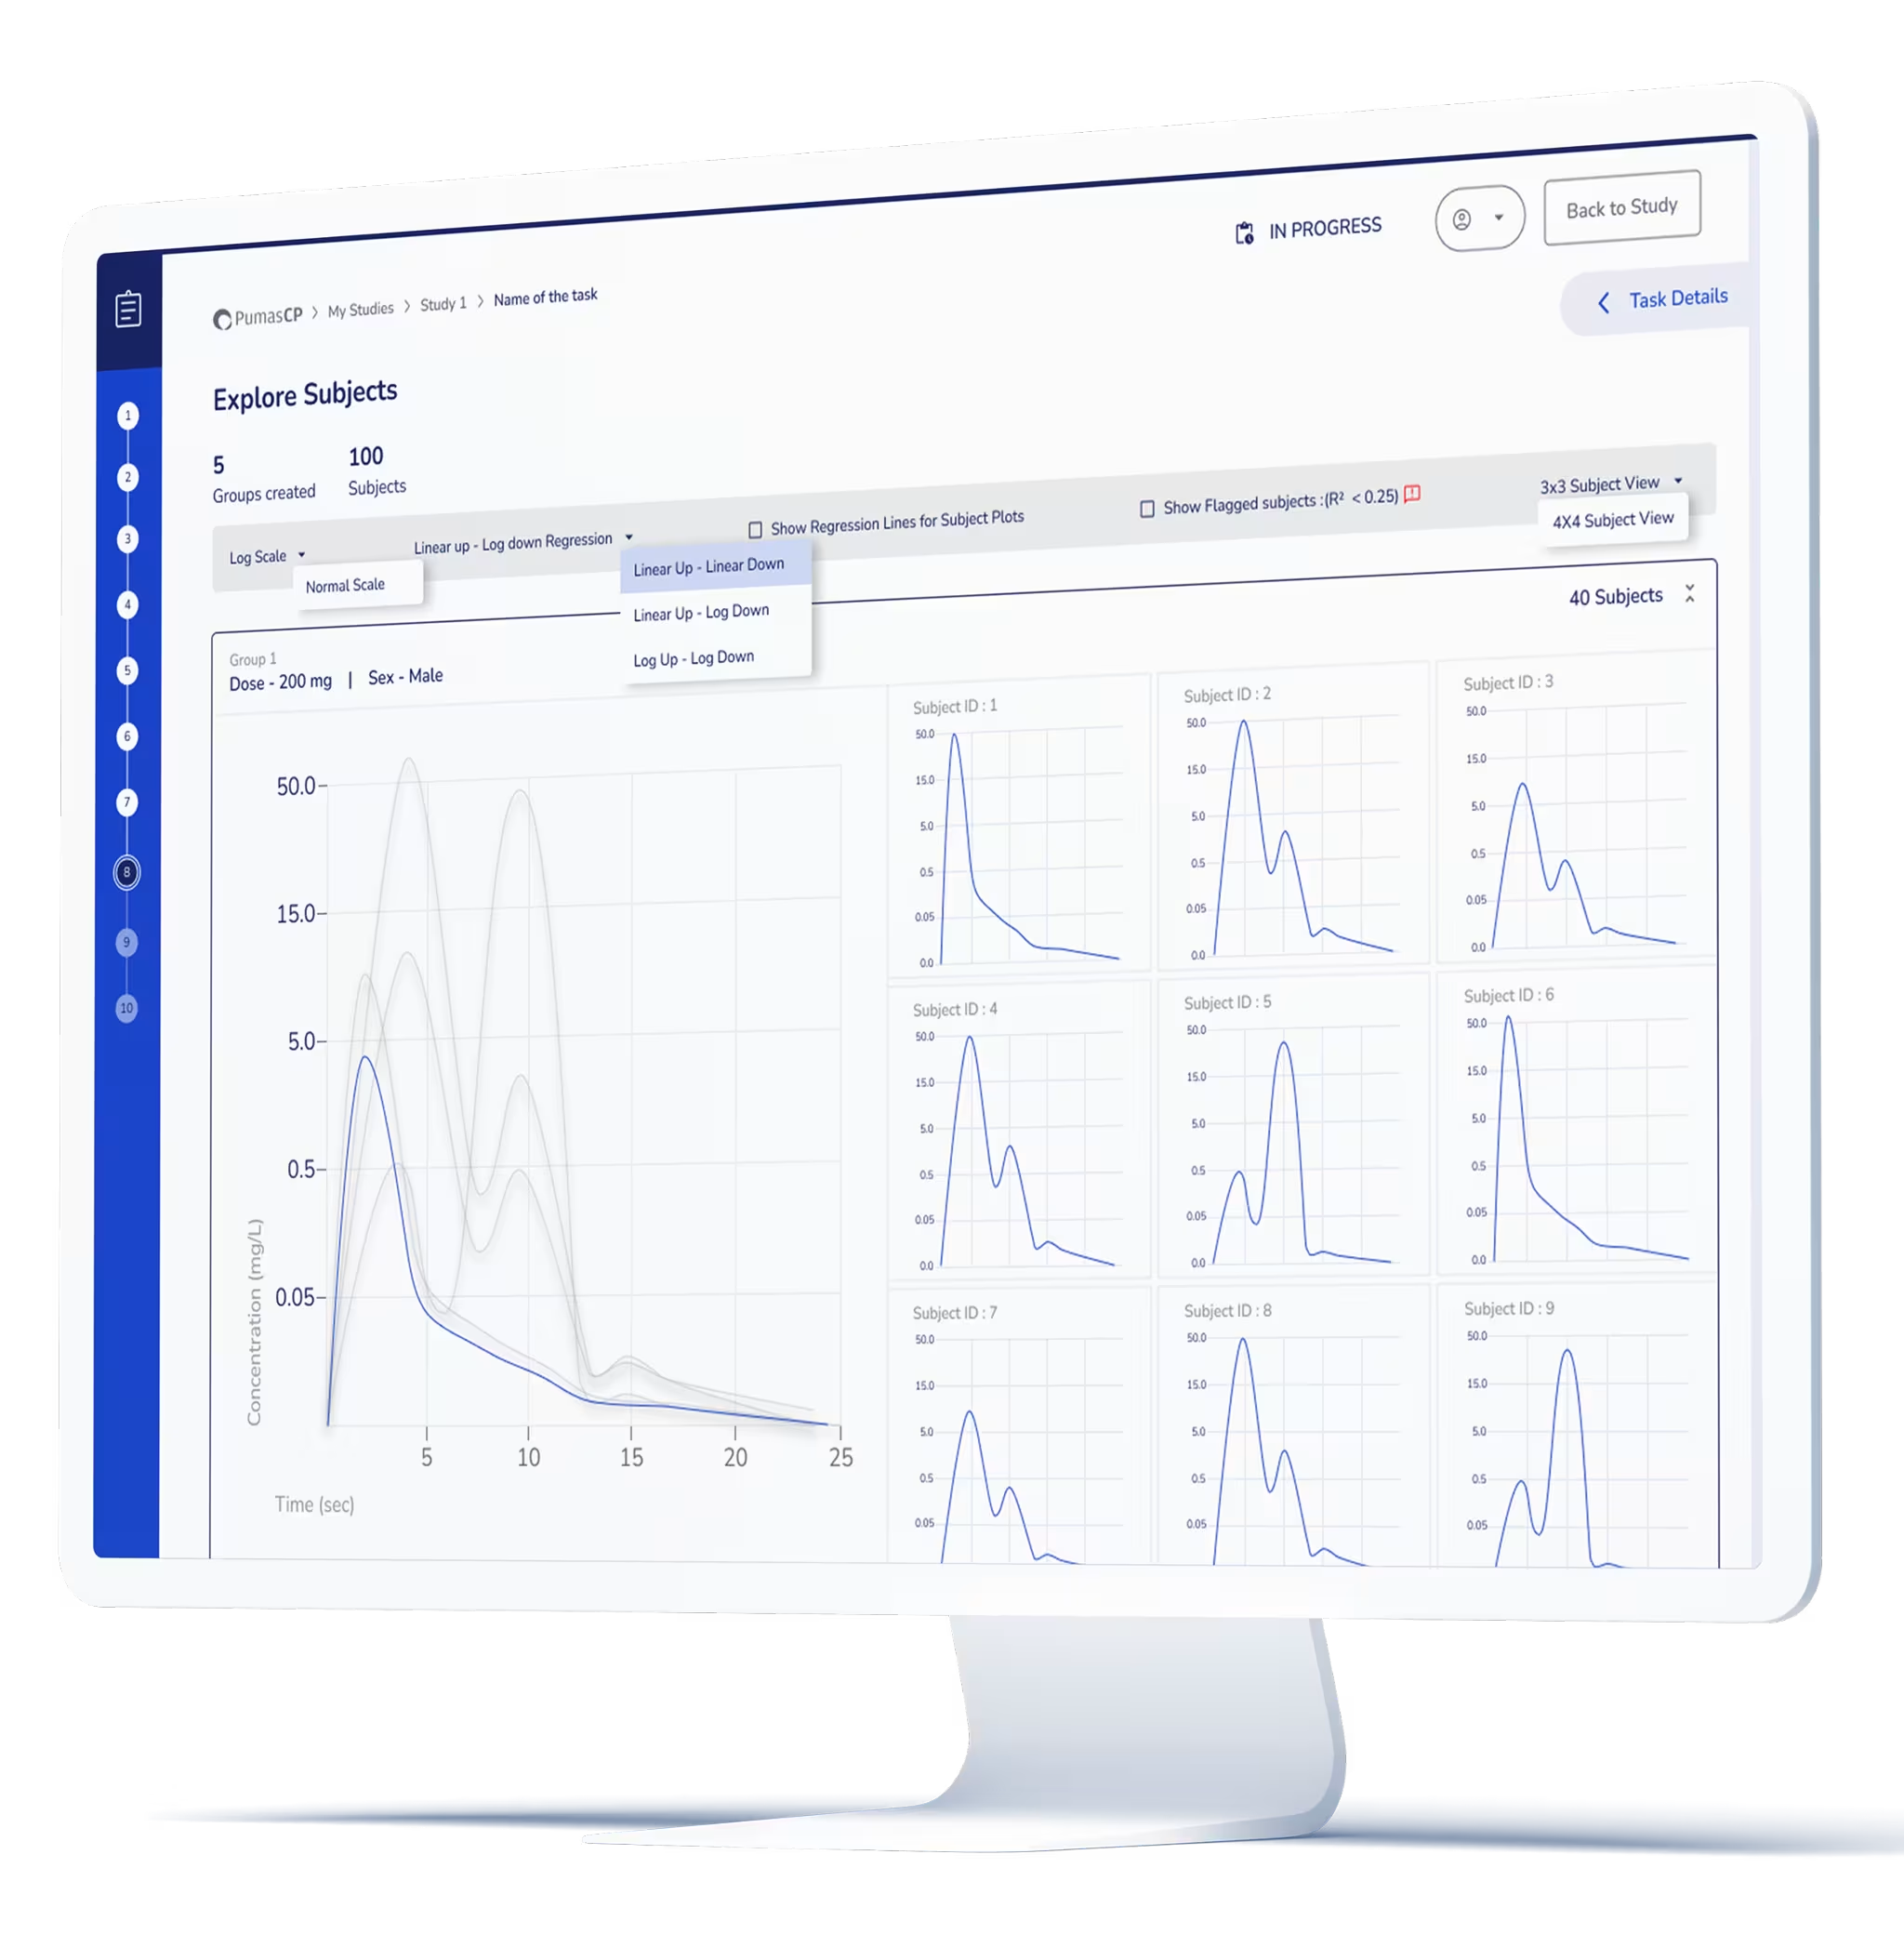

Designed software that visualises the PK curve of antipsychotic drugs, helping patients transition to Long Acting Injectables.
Teva Pharmaceutical Industries
Educational Dose Illustrator
Pharma and Lifesciences Software
UX and UI design, Information design, Data visualisation, Accessibility design, Interactive mockups
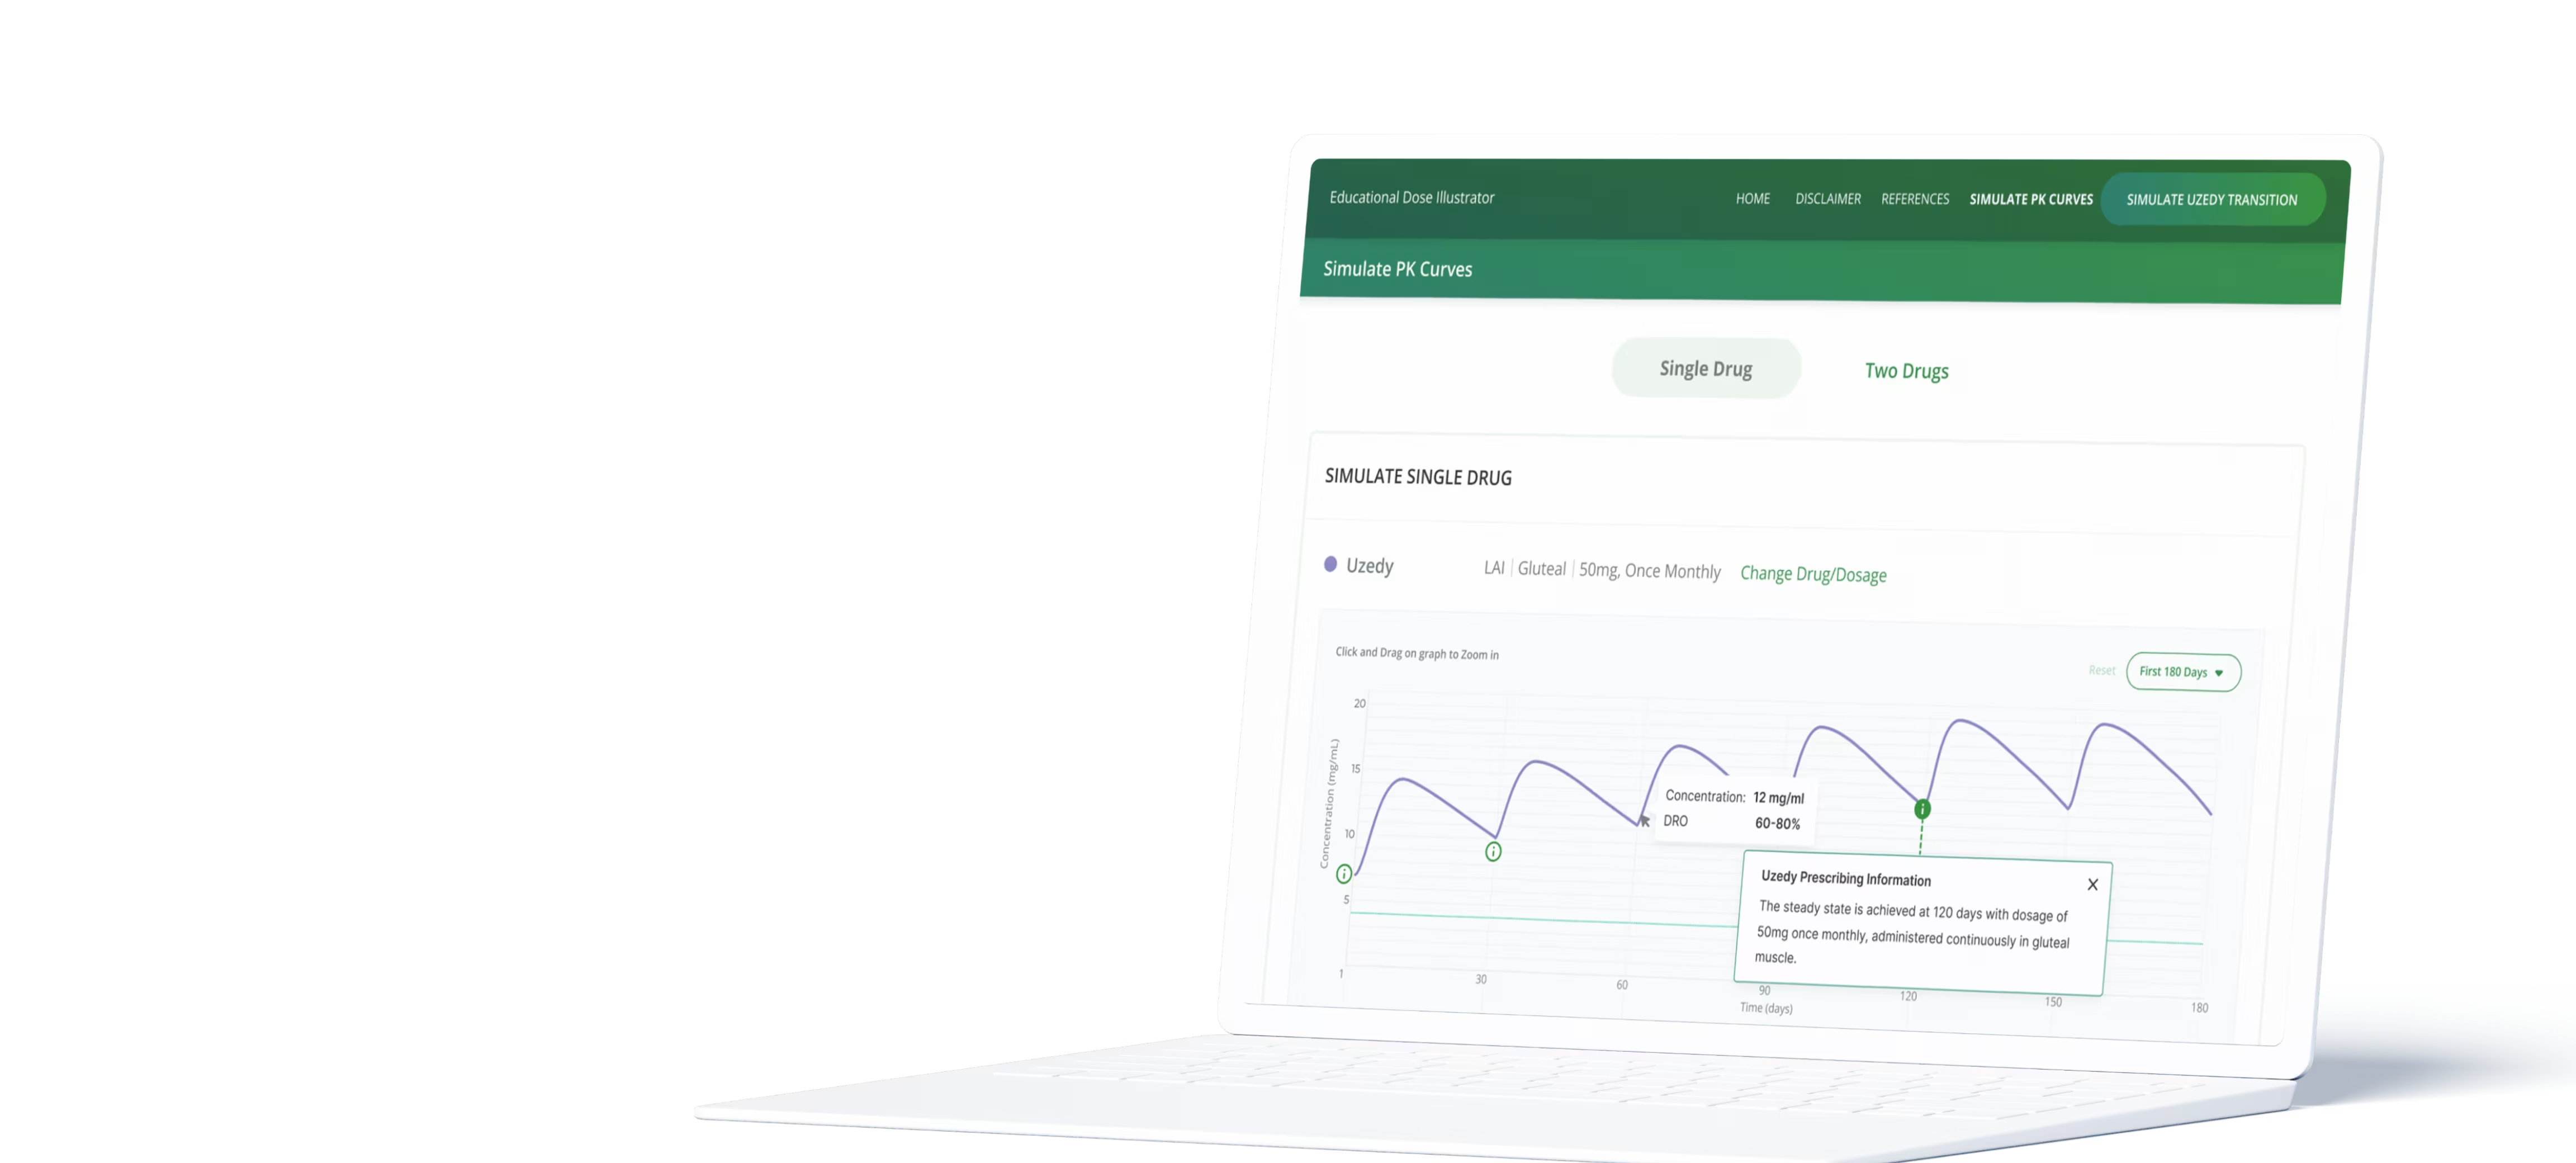
The client approached us with an idea to design a educational dosage illustrator web app that helps the physicians to compare the different drugs and with dosage options to visualise the simulations. The goal was to design a simple yet visually appealing user interface (UI) that could effectively display the behaviour of drug dosages and facilitate comparisons with other medications.
The focus was on creating a simple, intuitive, and visually appealing UI that effectively communicates complex medical concepts. We took a user-centred approach to designing an interface that is effective, easy-to-use, and accurate.
This tool is intended for physicians. Its primary purpose is to compare drug dosages and exhibit visual depictions of their effects on the bloodstream.
Tool intended for physicians
This drug dosage simulator was intended for use for education purpose only. The challenge lies in providing a simple, versatile, and powerful tool capable of showing various drug dosing scenarios and evaluating treatment outcomes.

To begin, we clearly defined the objectives, primary functionalities, intended users, and desired outcomes of the app. We conducted extensive research to understand the needs, preferences, and challenges of our target users. We identified that graphs are the core part of the tool and incorporated interactive elements to graphs to make it intuitive and easier for the physicians to use and infer the results.
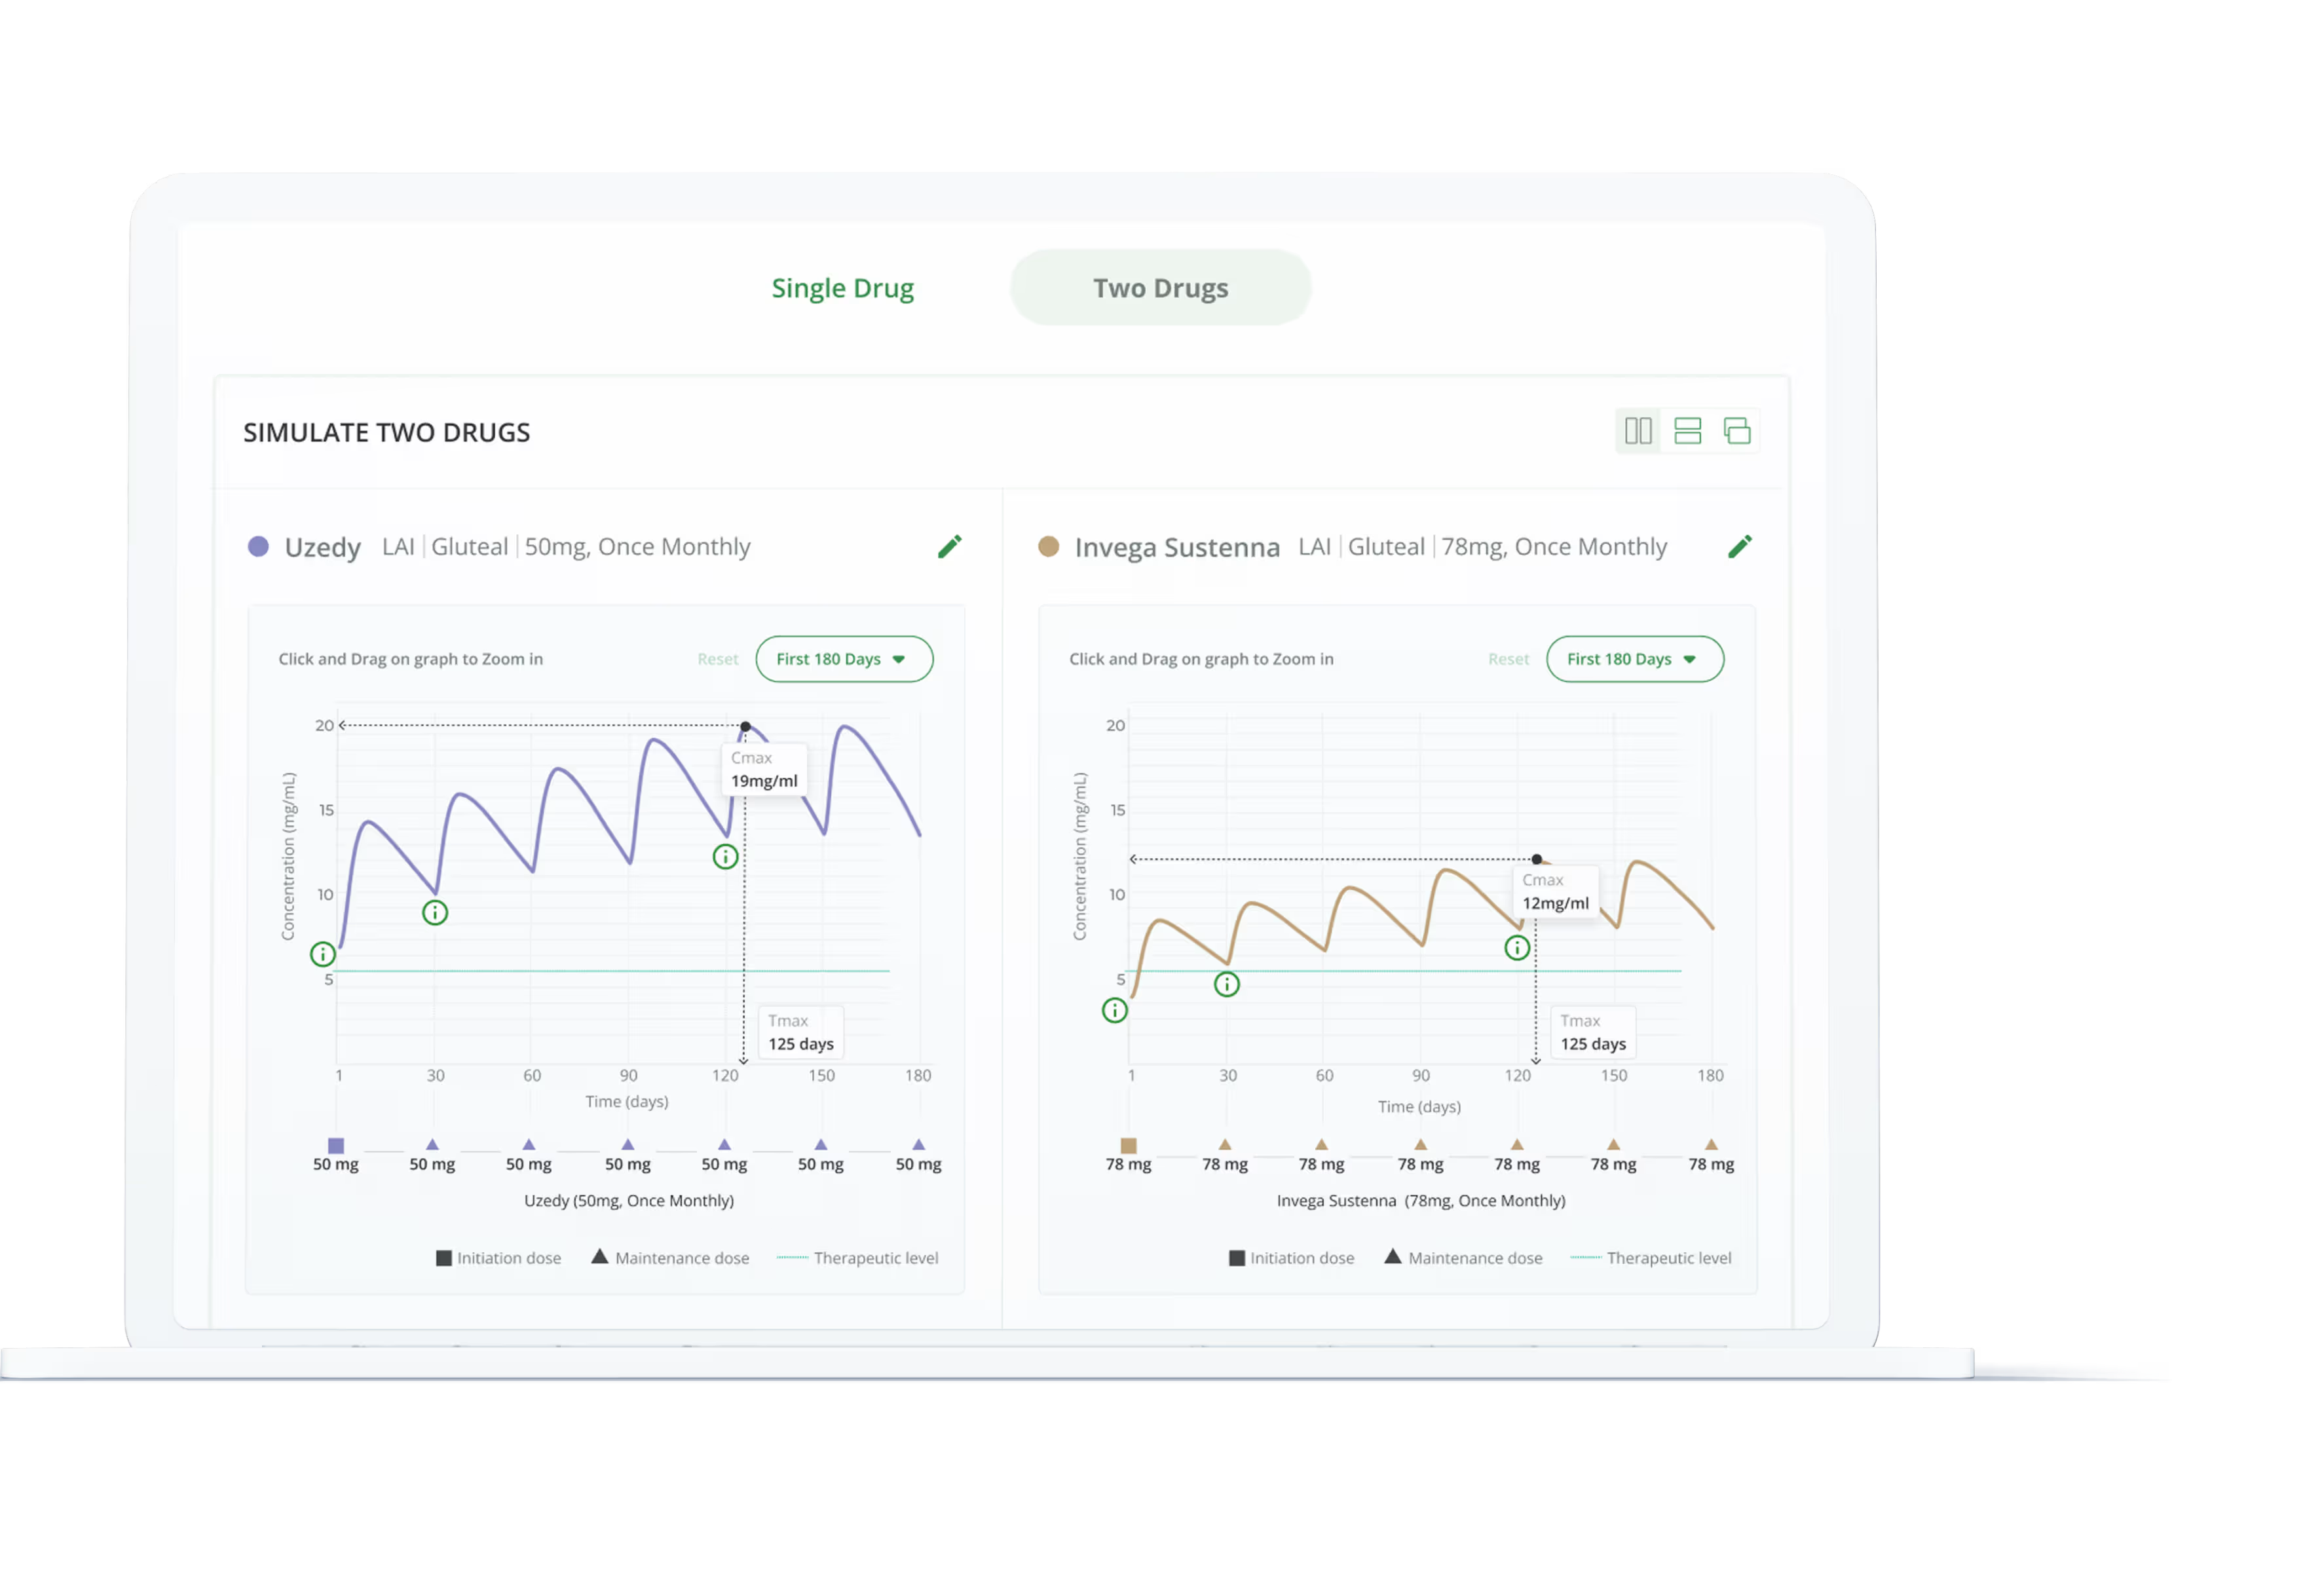
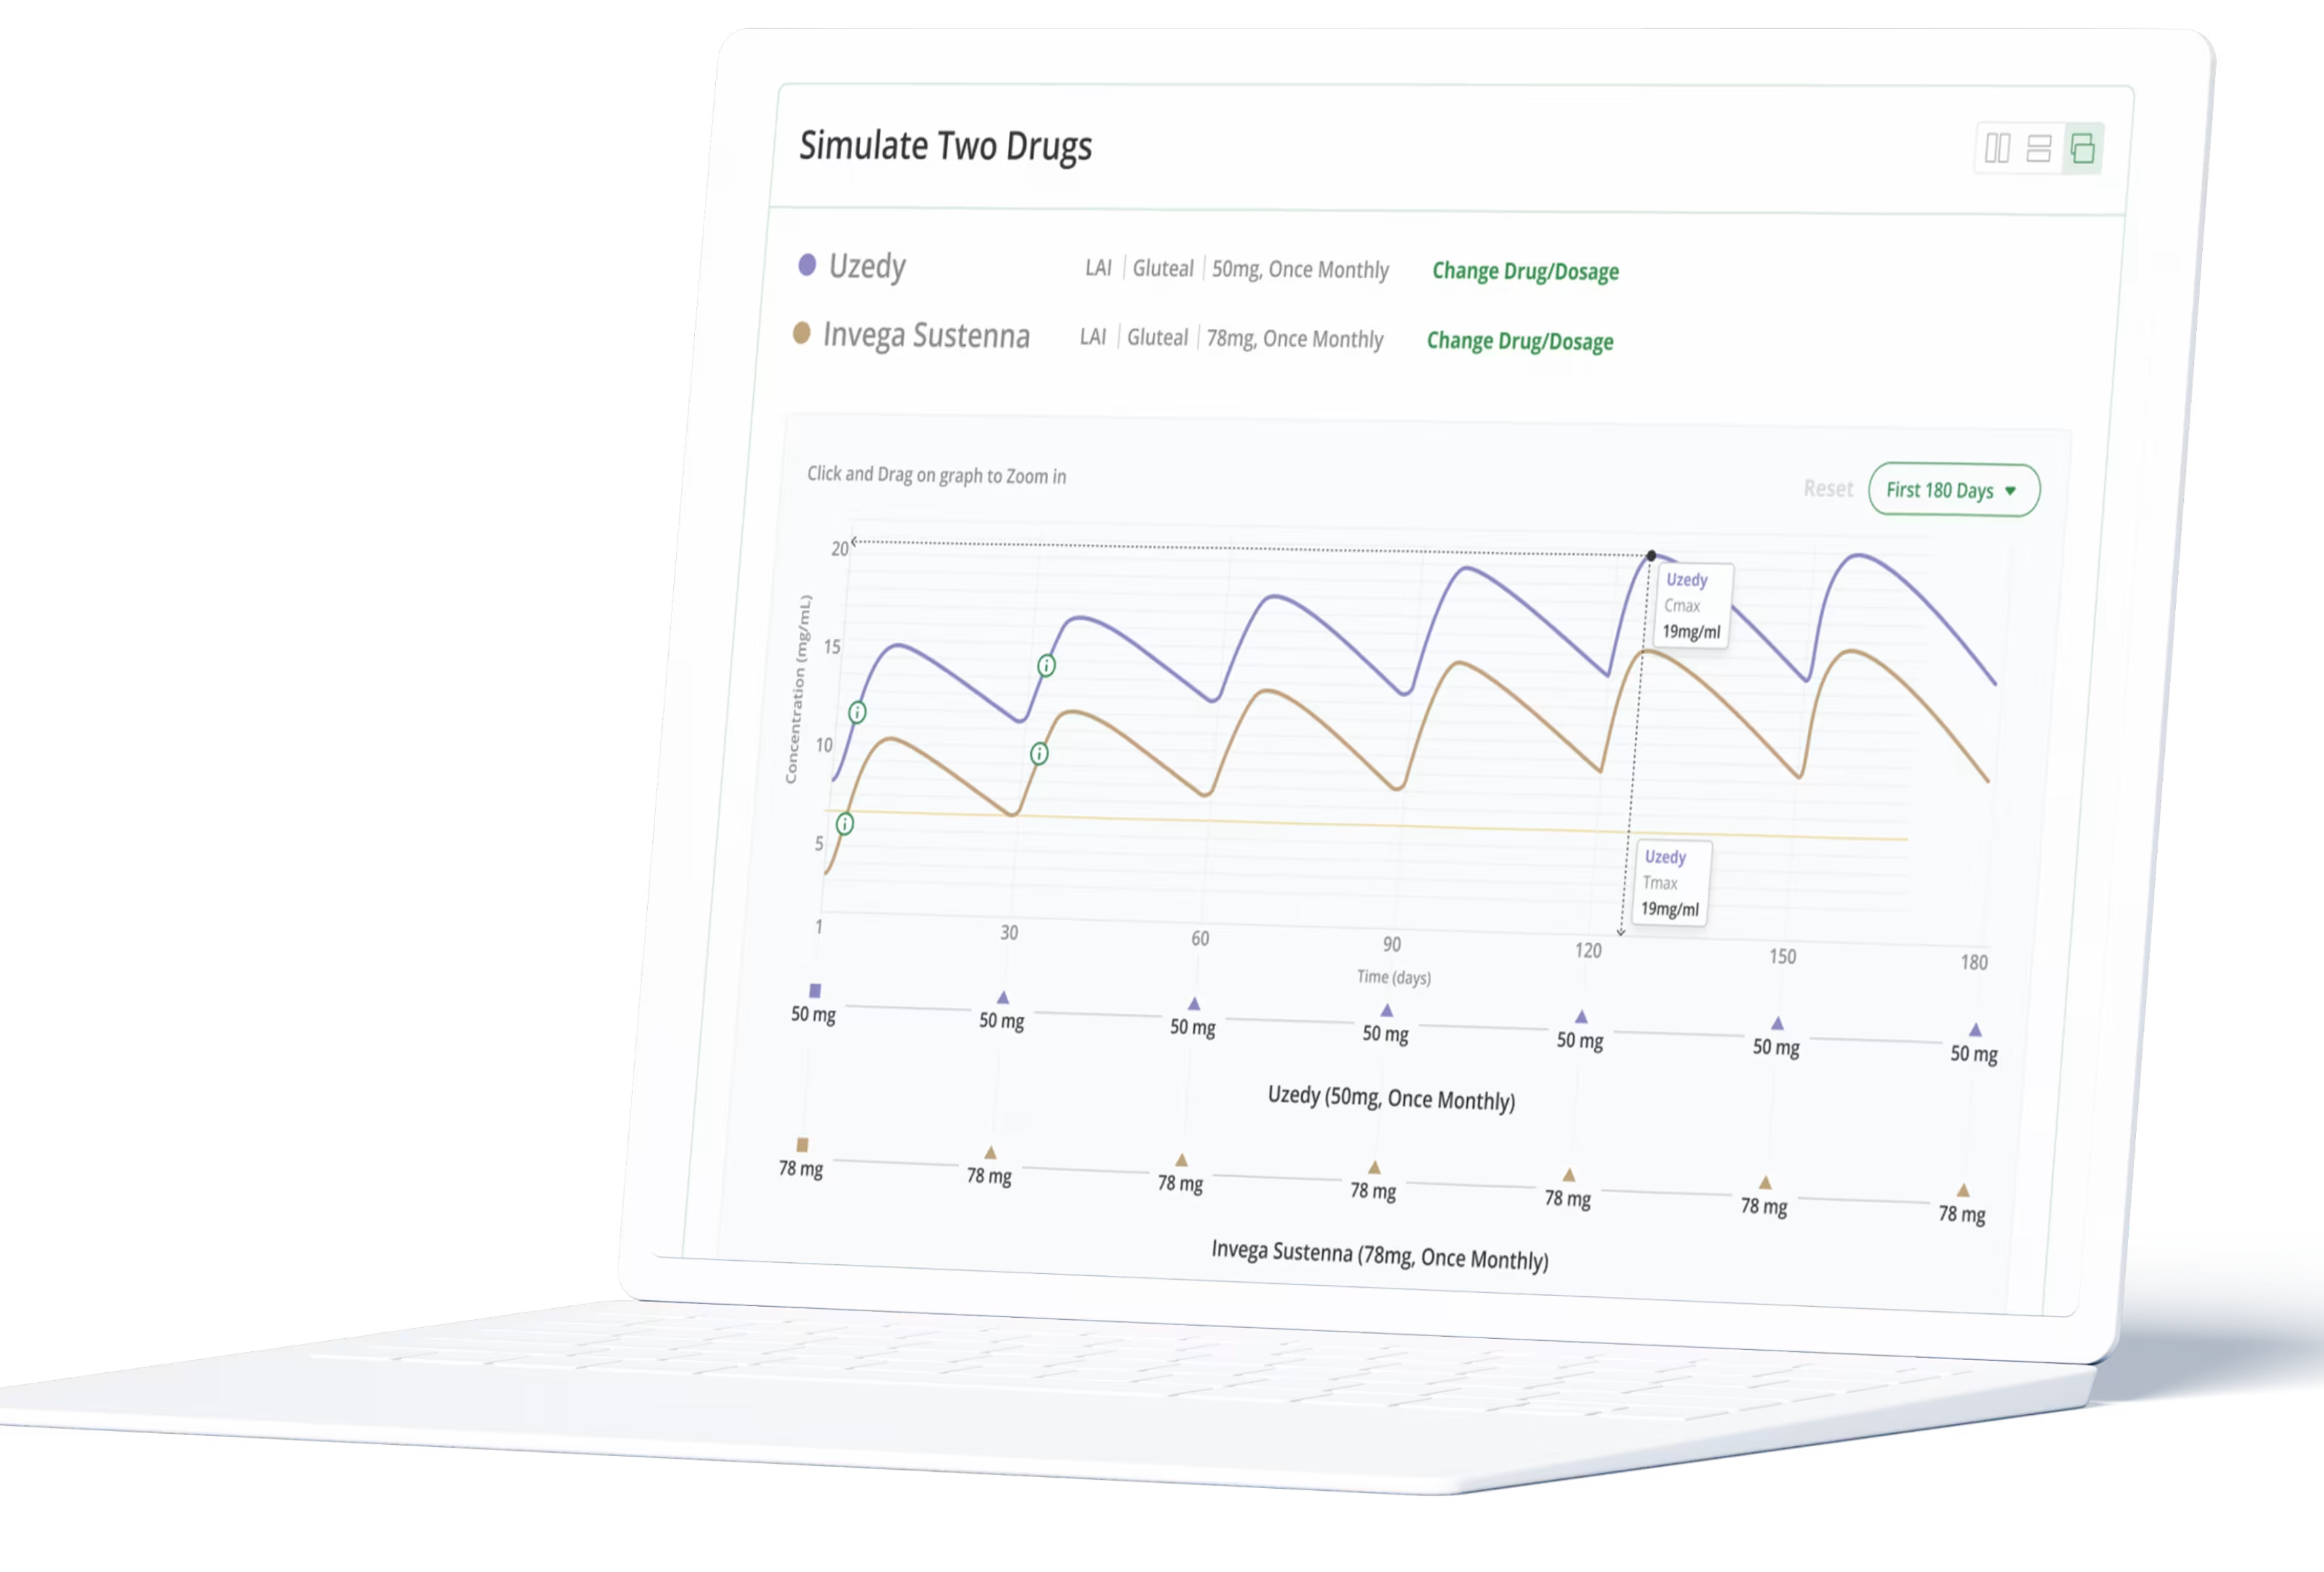
The core part being the graphs and two different drugs are compared, the challenge was to show them in most easier ways to infer and understand them. to solve this challenge we had used common ways to compare it three ways Side by Side, Top & Bottom and Overlay views. This approach gives physicians multiple options to look at the visualisations with preferred layout.
.webp)
.webp)
The outcome
A visually intuitive representation of the drug dosage simulator, depicting the drug's behavior within the bloodstream over different time periods. The simulator showcased the effects of a single drug dosage and enabled comparison between dosages of two different drugs, illustrating their respective behaviors. This custom-designed solution featured a user-friendly interface, effectively presenting the complexities of drug dosages in a simple and clear manner.
Partner with us to make your products impactful
Explore new possibilities with us
Designed software to automate routine analyses for scientists and obtain topline reports in minutes routine analyses for scientists and